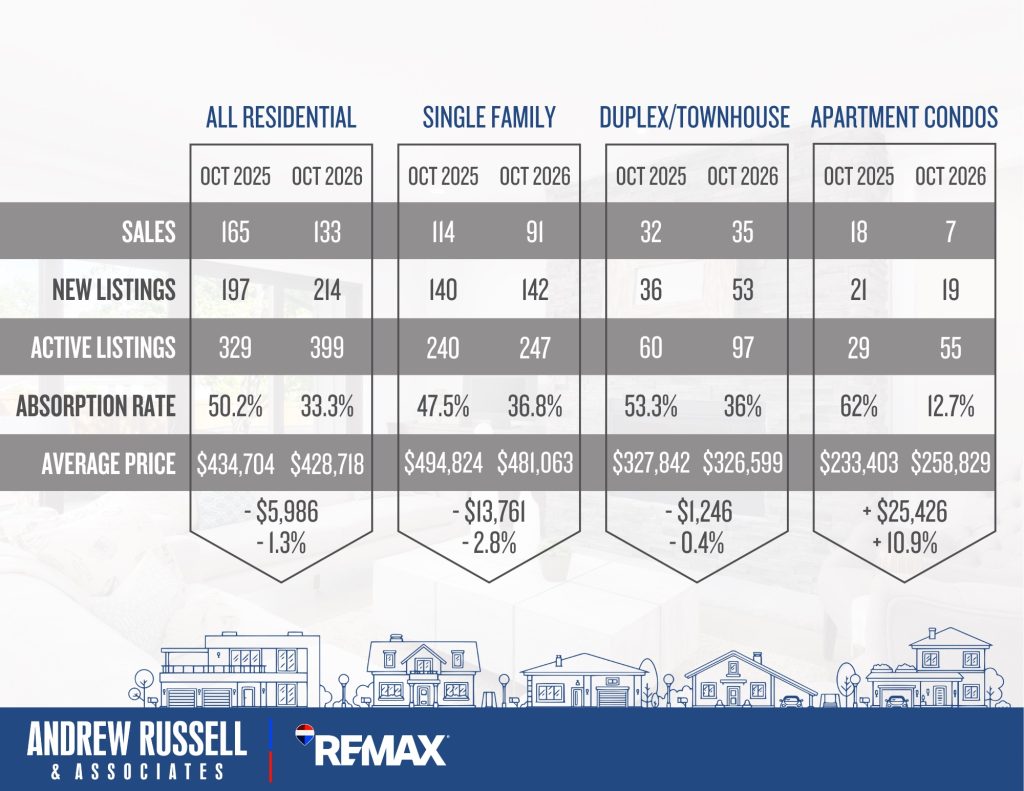
October market stats are attached, and the Red Deer real estate market continues to cool off as we move further into the fall, and we are now sitting comfortably in a balanced market. October was a bit of a roller coaster of activity, with good activity early on, then a slow down prior to Thanksgiving weekend (which is totally normal and expected). Things would normally pick up on the Tuesday after Thanksgiving, however the looming referendum vote on October 19th created enough uncertainty that many buyers chose to hang tight until the results of that came out. Once that was done, activity picked up again for about a week or so, and then the Bank of Canada raised interest rates 0.25%, which slowed things down again. In my experience, rate increases will calm activity for a couple of weeks, and then typically activity resumes as normal.
While activity will continually and gradually slow down as we move towards Christmas and the new year, I’m hoping we can find a bit more stability and consistency in November.
Overall I believe the big picture is still positive for Alberta, despite everything currently going on in the world. I dont believe we’re going to see the same level of activity in spring 2027 as we have over the last 3 years, however I don’t think we’re going to see any major drops in housing values either. Short of any major political events or massive interest rate hikes, I suspect 2027 will bring a steady, balanced market where prices stay relatively stable.
Here’s your quick stats for October:
Overall Market Trends
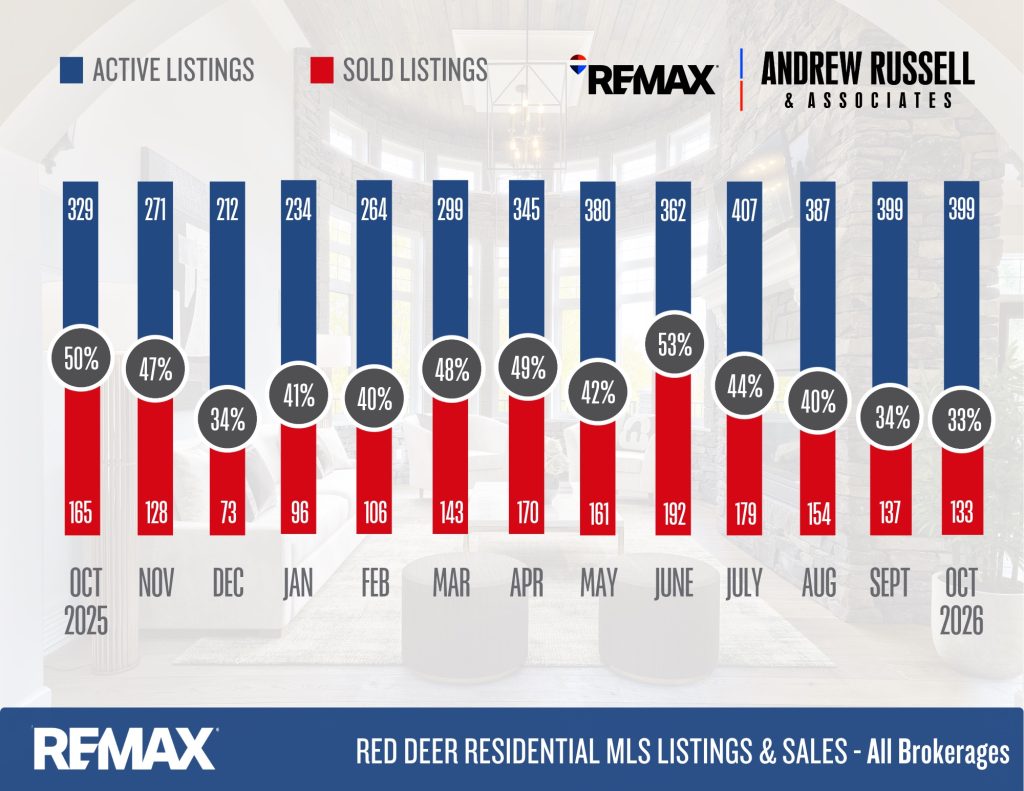
✅ Residential sales dropped 3% compared to September, while active inventory remained unchanged at 399 properties.
✅ The overall absorption rate slipped from 34% to 33%, keeping Red Deer in balanced market territory.
✅ The average residential sale price was $428,718, down just 1.3% year over year.
✅ Single family home prices averaged $481,063, down 2.8% compared to October 2025.
Single Family Homes
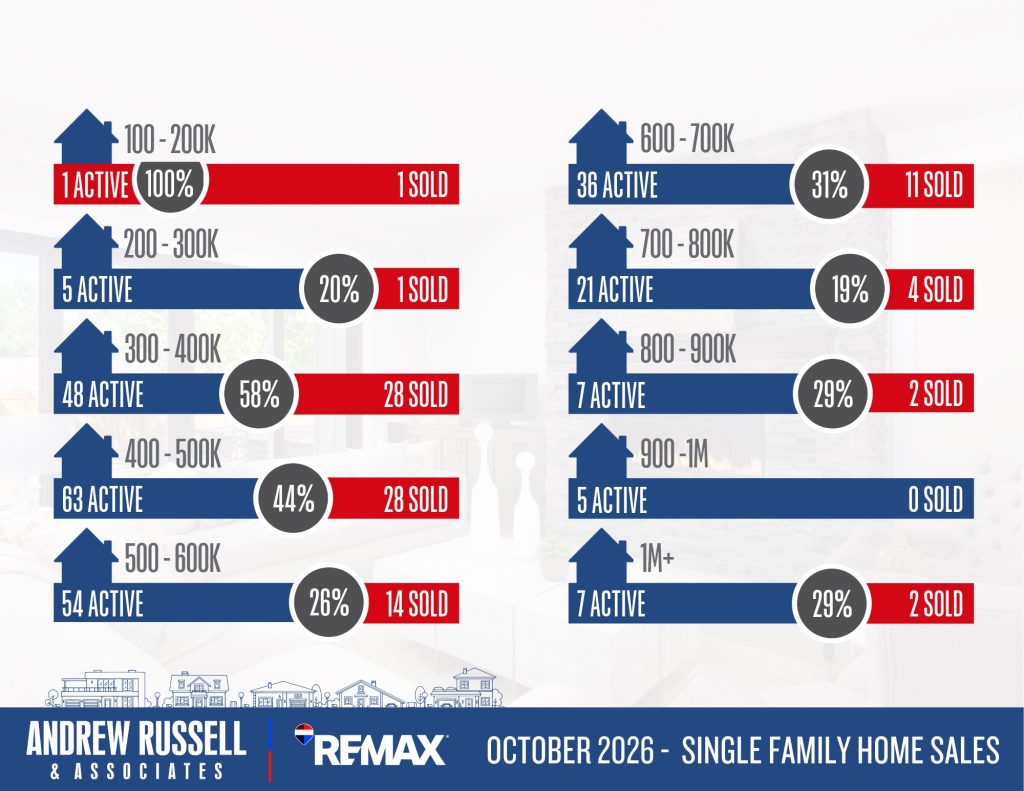
🏡 The $300,000 to $500,000 range remains strongest, accounting for over 60% of October’s sales.
🏡 Homes between $300,000 and $400,000 remain in a seller’s market with a 58% absorption rate.
🏡 Buyers between $500,000 and $800,000 have more selection, with 111 active listings.
Red Deer County Acreage Market
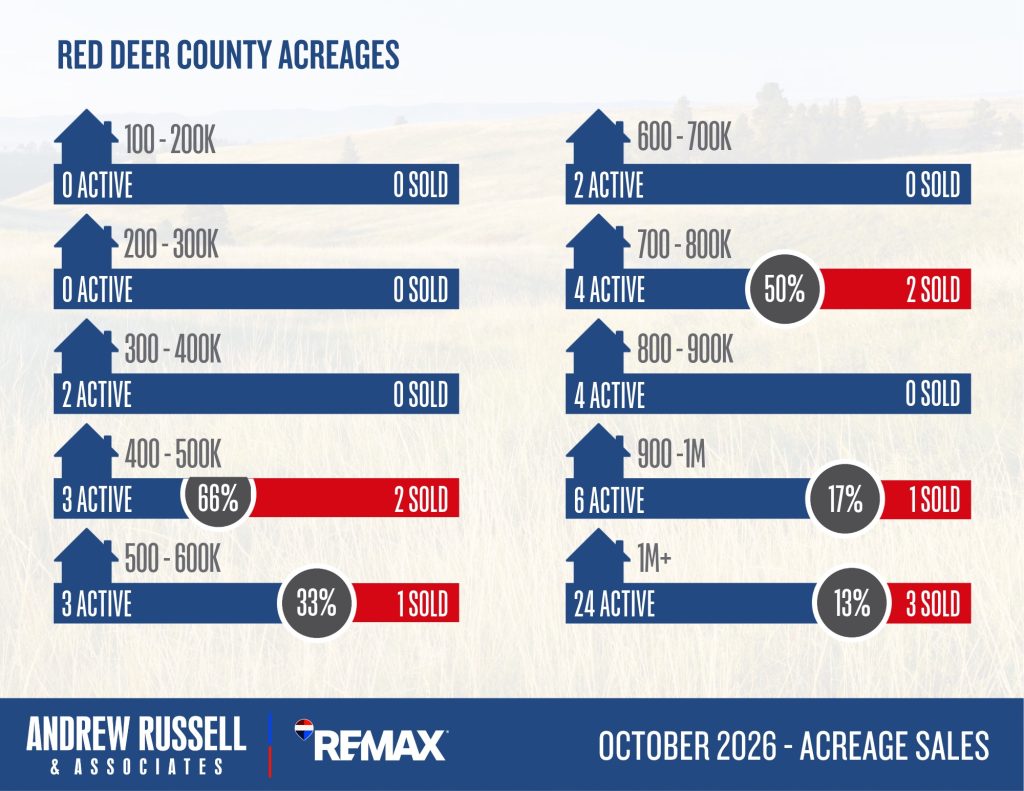
🌲 Inventory below $600,000 remains limited, with only 8 active properties.
🌲 The $700,000 to $800,000 range recorded 2 sales against only 4 active listings.
🌲 Above $1 million, buyers have the most selection with 24 active listings and just 3 sales.
Market Supply & Demand Trends
📈 Red Deer’s absorption rate has declined from 53% in June to 33% in October, reflecting a major shift towards balanced conditions.
📈 Red Deer currently has approximately 3 months of residential inventory at October’s sales pace.
📈 Single family homes remain relatively balanced with a 36.8% absorption rate.
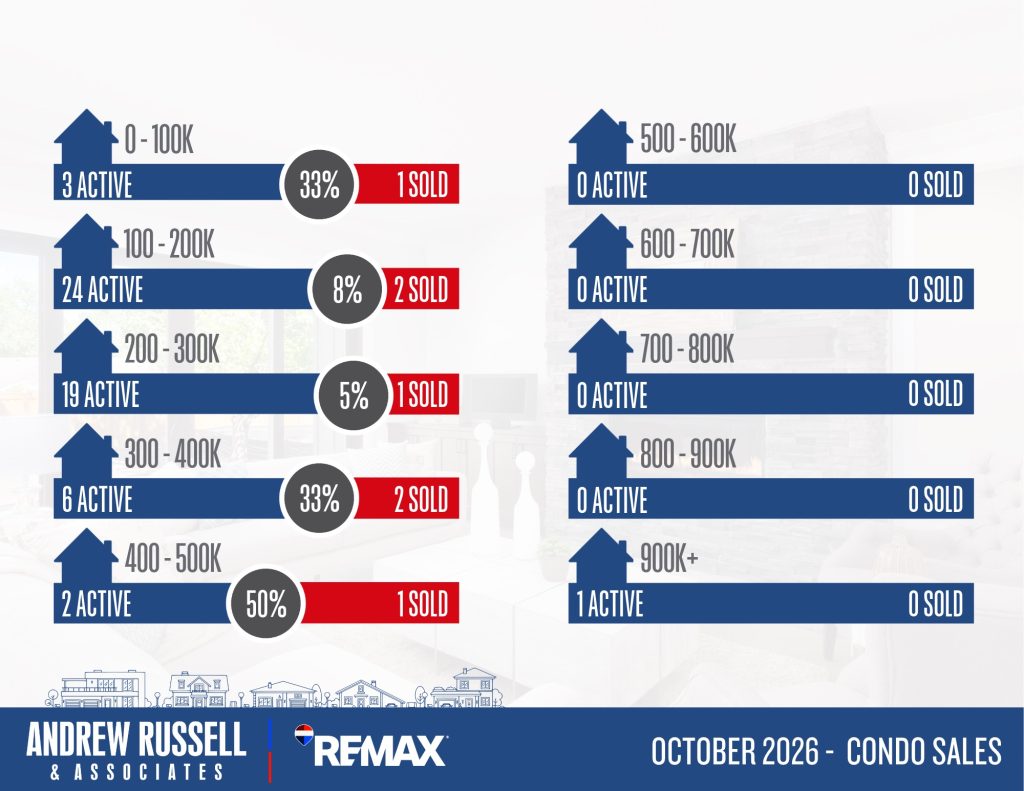
📈 Condo inventory nearly doubled from 29 to 55 listings, while sales dropped from 18 to just 7.
What This Means for Buyers & Sellers
Buyers:
✅ Buyers have more selection and more time to make decisions than they did during the spring and summer.
✅ Less competition is creating better opportunities to negotiate on price and terms.
✅ The $500,000 to $800,000 single family market offers good selection, although the most desirable homes can still sell quickly.
✅ Higher priced homes and acreages currently offer some of the best negotiating opportunities.
Sellers:
✅ Accurate pricing and presentation are increasingly important as buyers become more selective.
✅ Well priced homes are still selling successfully, particularly in the $300,000 to $500,000 range.
✅ Sellers should expect more negotiation and longer marketing times as we move into winter.
✅ Waiting until spring may bring more buyers, but also more competing listings.
Blackfalds:
Current Active Listings – 46
Sales in October – 18
Likelihood to Sell – 39% (Balanced Market)
Sylvan Lake:
Current Active Listings – 135
Sales in September – 30
Likelihood to Sell – 22% (Balanced Market)
Penhold:
Current Active Listings – 7
Sales in September – 5
Likelihood to Sell – 71% (Seller’s Market)
Data sourced from Red Deer MLS residential sales, November 2026. All brokerages included.