While sales activity has picked up from a slower September, it’s a much different market currently than it was in the spring and summer months. Multiple offers are a rare occurrence, buyers are coming in with lower initial offers, and they’re expecting more negotiation room especially for homes that are less in demand. Overpriced homes are sitting for longer periods of time, and many price categories have returned to a balanced market pace.
Overall Market Trends
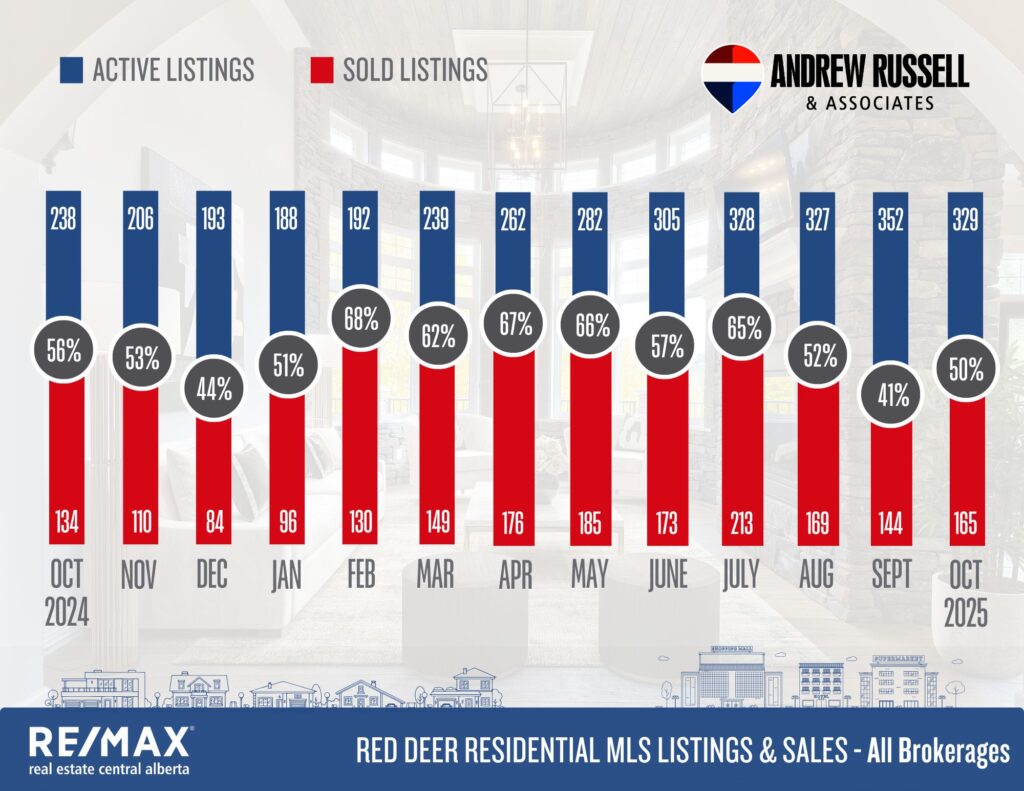
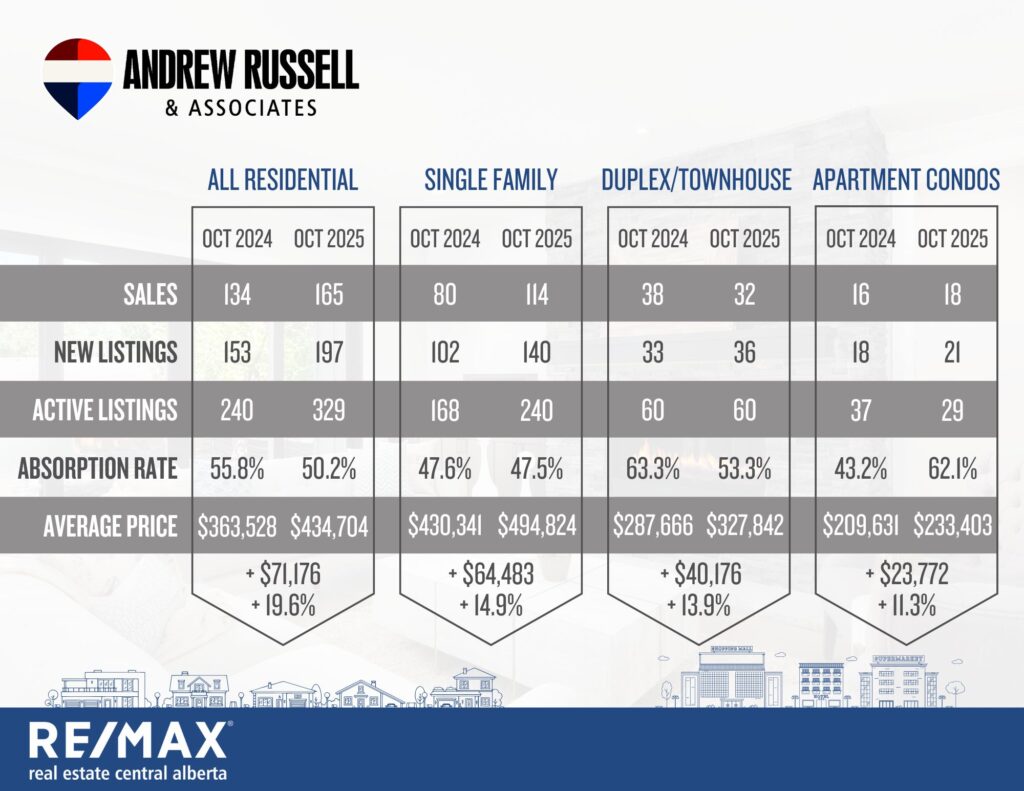
✅ Sales Activity: Total residential sales climbed to 165, up from 134 in October 2024 — a solid year-over-year increase.
✅ New Listings: Rose to 197, compared to 153 the year prior, showing renewed seller confidence.
✅ Active Listings: Inventory increased to 329 from 240 in 2024, offering buyers more selection this year.
✅ Absorption Rate: Hit 50.2%, up from 41% in September, still reflecting a healthy and active market.
✅ Average Price: Jumped to $434,704, up 19.6% year-over-year from $363,528 — a significant rise driven by strong demand and higher-end sales.
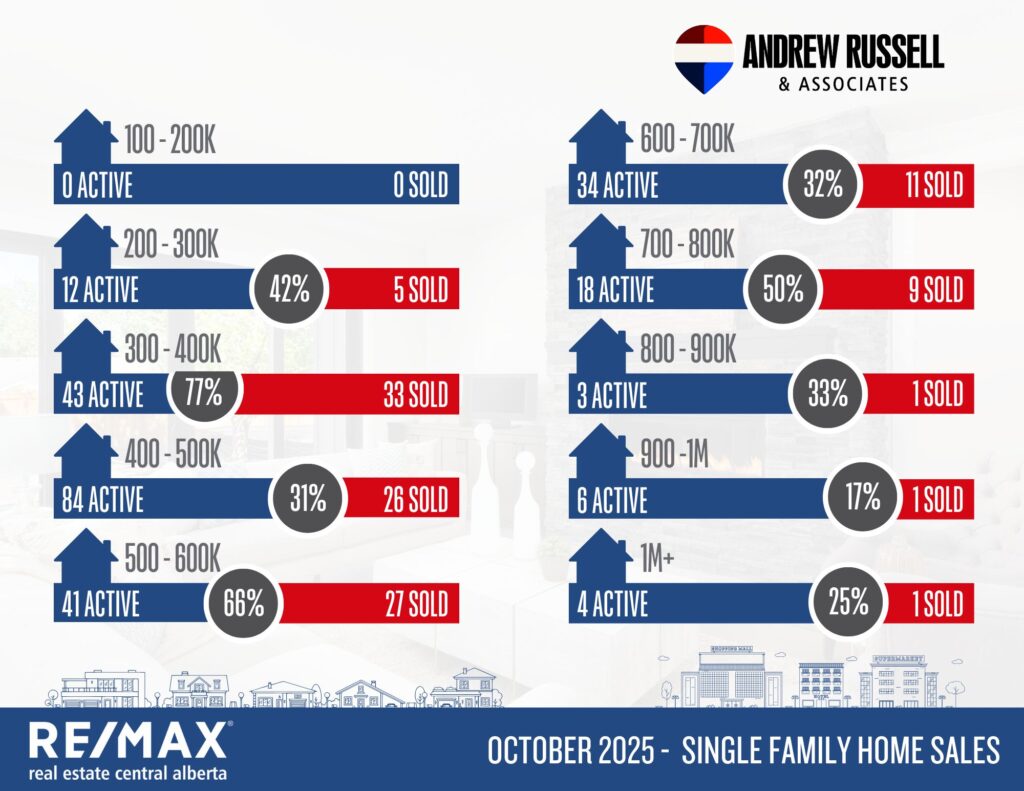
Single Family Homes
🏡 Sales Performance: Sales rose to 114, up from 80 in October 2024.
🏡 New Listings: Increased to 140, compared to 102 last year.
🏡 Absorption Rate: Held steady at 47.5%, nearly identical to last year’s 47.6%.
🏡 Price Trends: The average price jumped 14.9%, from $430,341 to $494,824, reflecting continued strength in mid-range detached homes.
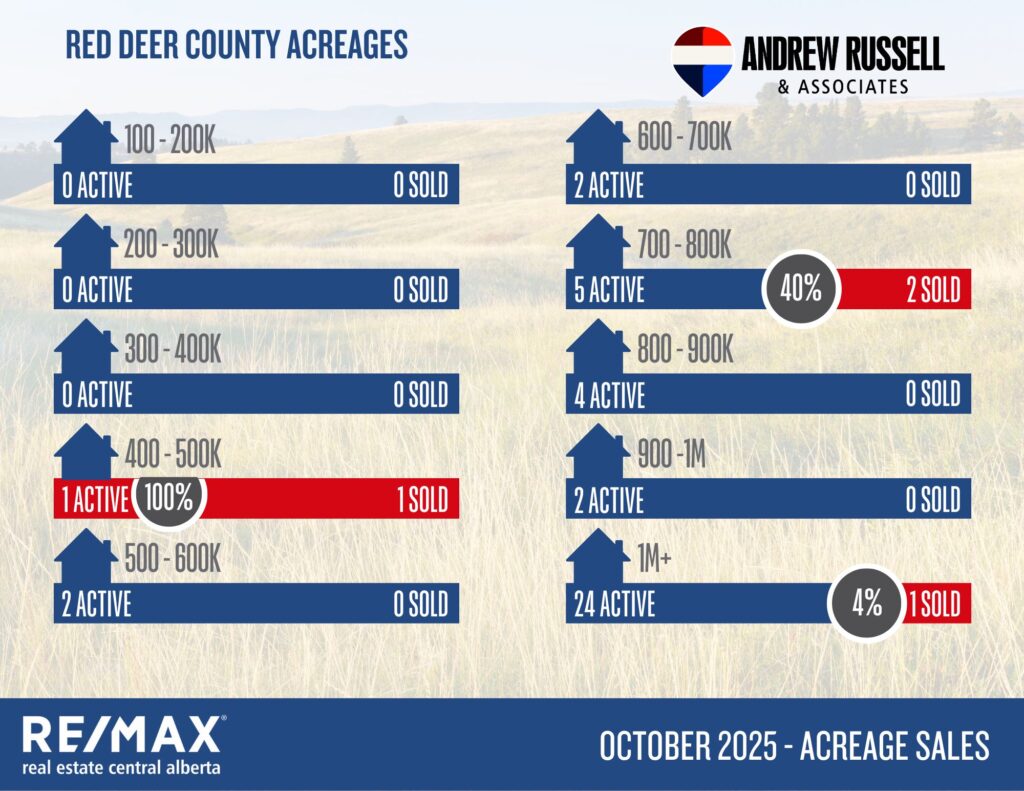
Red Deer County Acreage Market
🌲 Low-Range Activity: One sale occurred in the $400K–$500K range, fully absorbing available inventory.
🌲 Mid-Range ($700K–$800K): Continued buyer interest with 40% absorption (2 sold / 5 active).
🌲 Luxury Acreages ($1M+): Slower pace at 4% absorption (1 sold / 24 active), consistent with seasonal trends.
Market Supply & Demand Trends
📈 Inventory Growth: October saw higher active listings across all categories, particularly in single-family and condo segments.
📊 Balanced Absorption: Demand remains consistent in affordable and mid-tier price ranges.
🏘️ Duplex/Townhouse Market: Sales dipped slightly from 38 to 32, but average prices climbed 13.9% to $327,842.
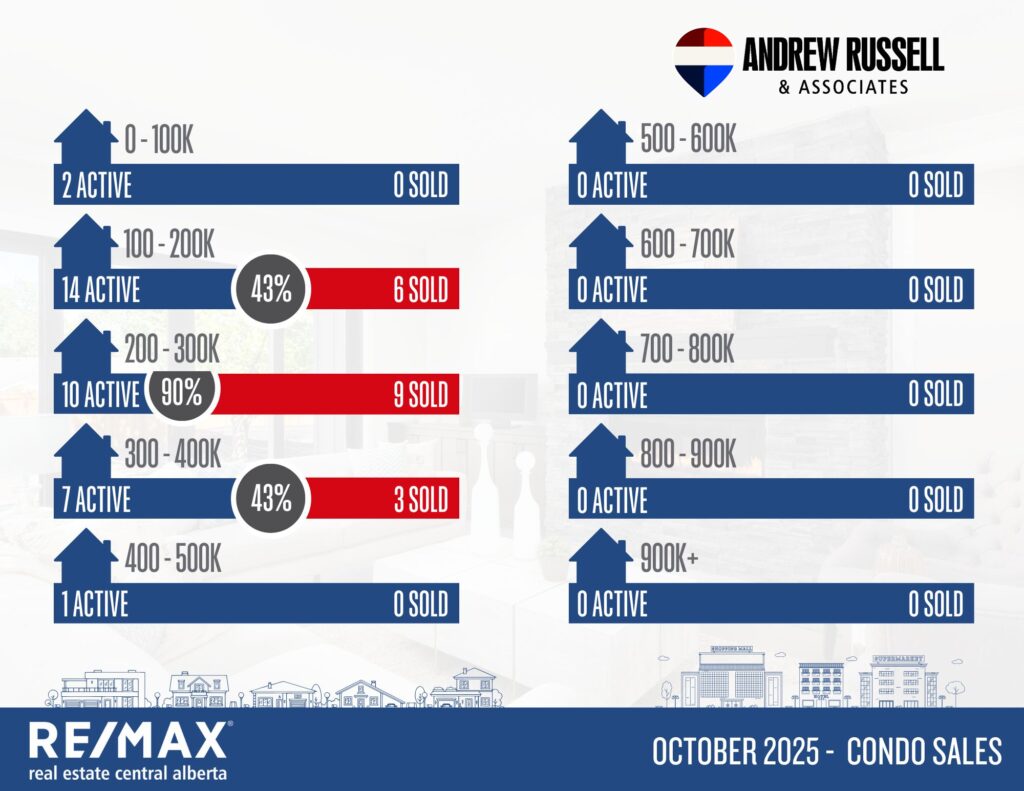
🏢 Apartment Condos: Continued to strengthen, with the average price up 11.3% to $233,403 and absorption improving to 62.1%.
What This Means for Buyers and Sellers
Buyers:
✅ Broader Selection: Increased listings mean more choice and reduced pressure in many segments.
✅ Mid-Range Momentum: Homes between $300K–$600K remain highly competitive — act quickly when the right one appears.
✅ Negotiation Power at the Top End: Slower luxury and acreage markets offer room for negotiation.
Sellers:
✅ Strong Pricing Gains: Year-over-year price growth remains impressive across all property types.
✅ Mid-Range Advantage: Sellers in the $300K–$500K range continue to experience high absorption and quick sales.
✅ Strategic Positioning Needed: With inventory up, pricing and presentation are critical to stand out.
Out of Town Snapshot:
Blackfalds:
Current Active Listings – 51
Sales in October – 29
Likelihood to Sell – 57% (Seller’s Market)
Sylvan Lake:
Current Active Listings – 116
Sales in October – 41
Likelihood to Sell – 35% (Balanced Market)
Penhold:
Current Active Listings – 17
Sales in October – 5
Likelihood to Sell – 29% (Buyer’s Market)