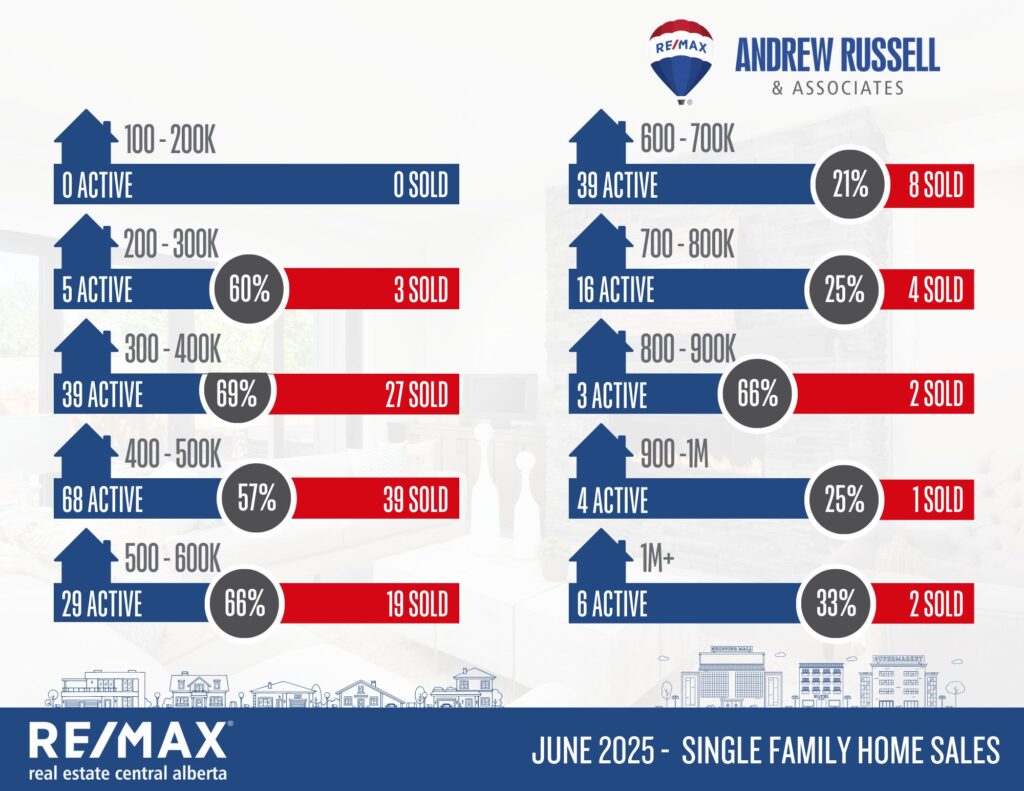
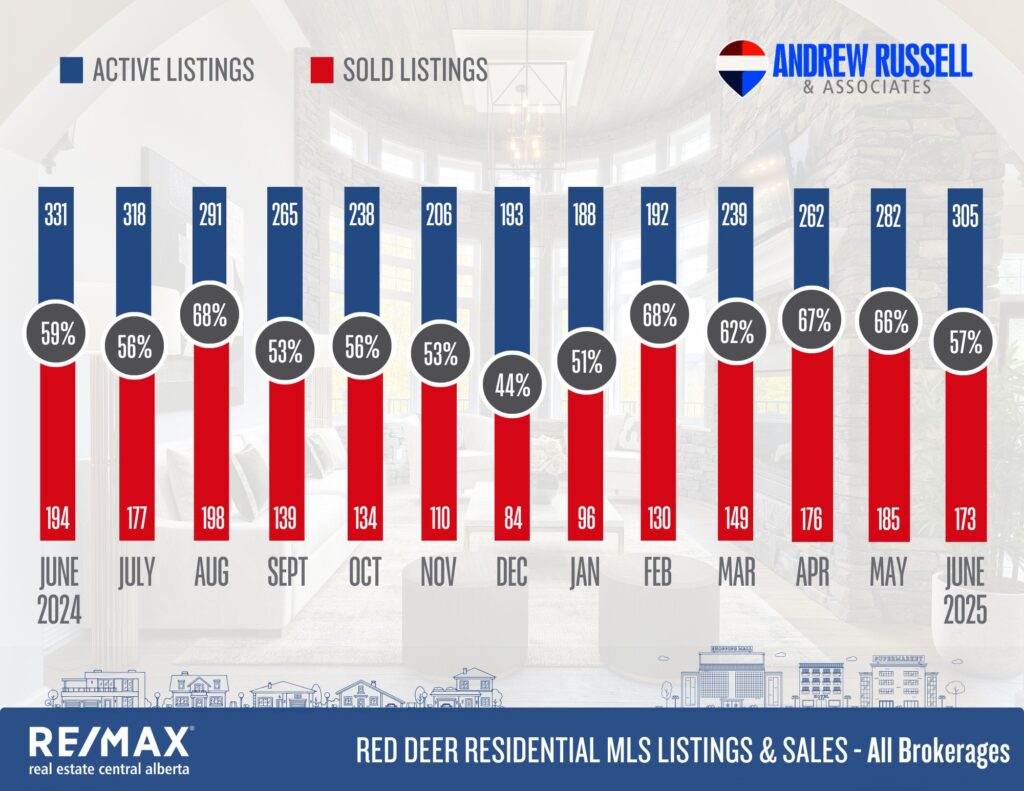
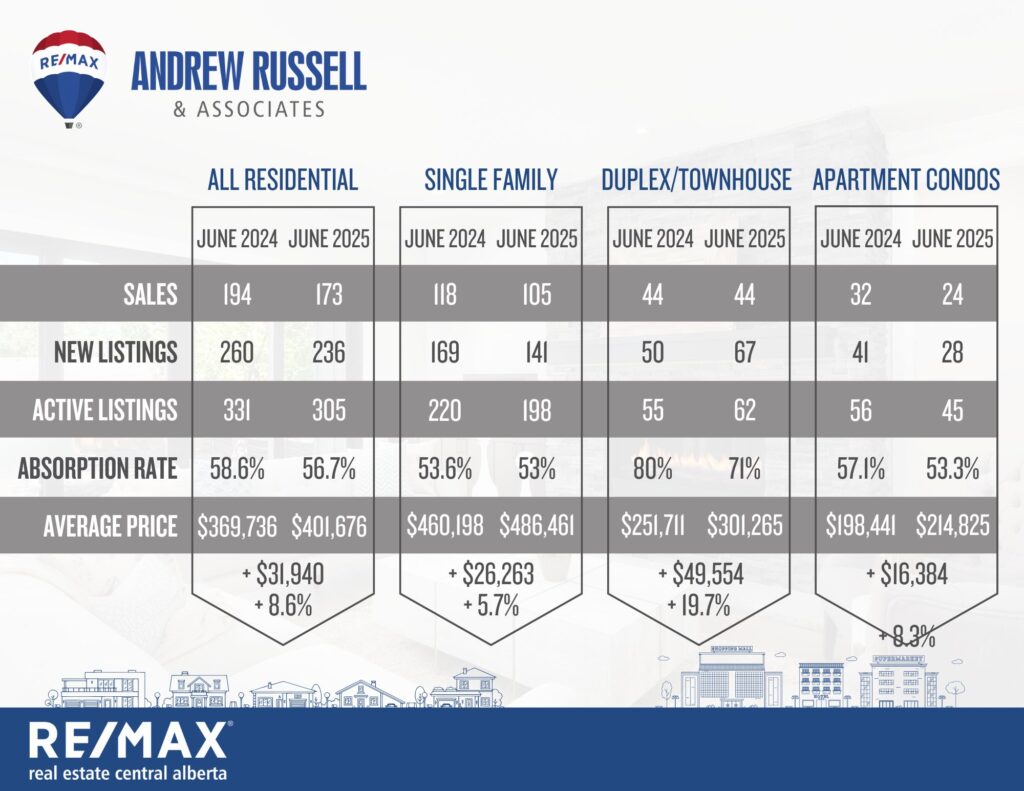
The summer market is moving along nicely and the market is still very active. Active listings finally snuck over the 300 mark for the first time this year, which is typical as listing inventories typically will peak somewhere around June. Prices are still pushing for homes under 500k although things have seemingly started to stabilize a bit despite still seeing lots of multiple offer situations on lower priced homes.
Here’s your quick stats for June:
Overall Market Trends
✅ Sales Activity: Total residential sales in June 2025 dipped to 173, down from 194 in June 2024.
✅ New Listings: Decreased slightly to 236, compared to 260 the year before.
✅ Active Listings: Dropped modestly to 305, down from 331 in June 2024.
✅ Absorption Rate: Remains stable at 56.7%, reflecting an overall seller’s market.
✅ Average Home Price: Climbed to $401,676, up from $369,736 last year—a healthy 8.6% increase.
Single Family Homes
???? Sales Performance: Sales saw a slight dip, dropping from 118 in June 2024 to 105 in June 2025.
???? New Listings: Fell to 141, compared to 169 a year ago.
???? Absorption Rate: Slightly down to 53%, still a seller’s market.
???? Price Trends: The average price rose by 5.7% year-over-year, from $460,198 to $486,461.
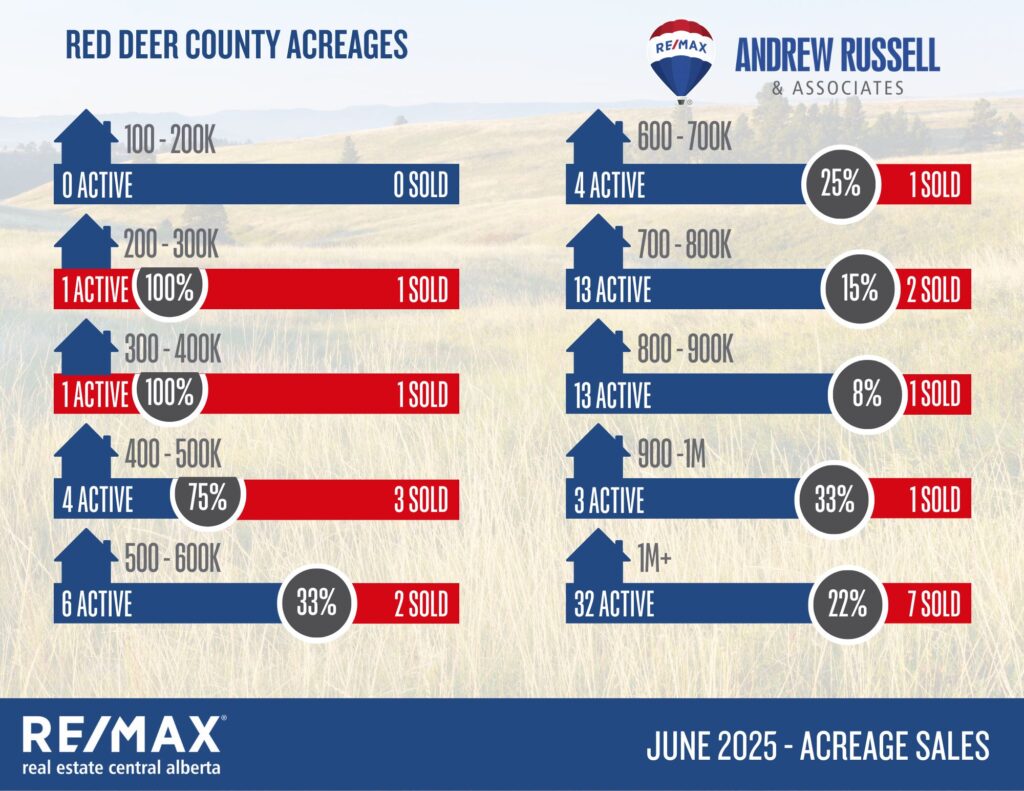
Acreage Market
???? Strong Low-Range Activity: Acreages between $200K–$400K saw full absorption, with every active listing sold.
???? Moderate Mid-Range Demand: Acreages between $400K–$600K showed steady activity, with a 75% absorption rate in the $400K–$500K range and 33% in the $500K–$600K range.
???? Luxury Market Slowdown: Acreages priced between $600K–$900K experienced slower sales, with absorption rates ranging from 8% to 25%, while the $1M+ segment saw 7 sales out of 32 active listings, for a 22% absorption rate.
Market Supply & Demand Trends
???? Inventory Movement: Active listings continued their gradual climb month-over-month, reaching 305 by June 2025.
???? Sales Volume: Sales remained steady compared to prior months but are lower than peak periods seen earlier this year.
⬆️ Duplex/Townhouse Segment: High absorption at 71%, with average prices surging 19.7% year-over-year to $301,265.
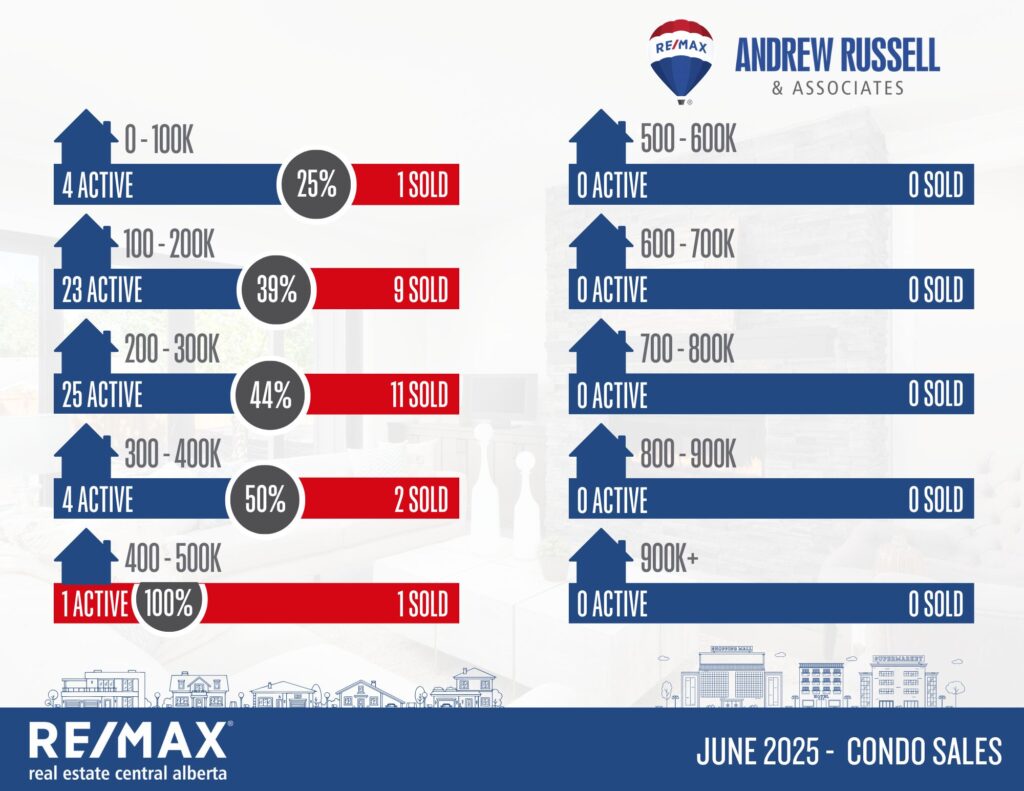
⬆️ Condo Market: Apartment condos also saw price gains of 8.3% to an average of $214,825, though sales volume softened slightly.
What This Means for Buyers and Sellers
Buyers:
✅ High Competition in Mid-Range: Homes priced between $300K–$500K are selling quickly, buyers need to move quickly on good properties.
✅ Stable Prices: Gradual price increases, but no sudden spikes, allowing for steady planning.
✅ Luxury Segment Leverage: Higher-priced homes ($600K+) and acreages are slower-moving, buyers have some ability to negotiate on these homes.
✅ Acreage Opportunities: Moderate inventory and slower turnover offer breathing room for higher end acreage buyers.
Sellers:
✅ Mid-Range Market Sweet Spot: If you’re selling in the $300K–$500K bracket, demand is strong and consistent.
✅ Reduced Competition: Fewer listings mean your property may attract more attention.
✅ Caution on High-End Pricing: Overpricing in the $600K+ market can lead to longer selling times, pricing strategically is key.
✅ Summer Selling Window: This remains a great time to list before the market will likely cool down a bit in September.
Blackfalds:
Current Active Listings – 59
Sales in June – 42
Likelihood to Sell – 71% (Seller’s Market)
Sylvan Lake:
Current Active Listings – 117
Sales in June – 43
Likelihood to Sell – 37% (Balanced Market)
Penhold:
Current Active Listings – 19
Sales in June – 4
Likelihood to Sell – 21% (Balanced Market)
