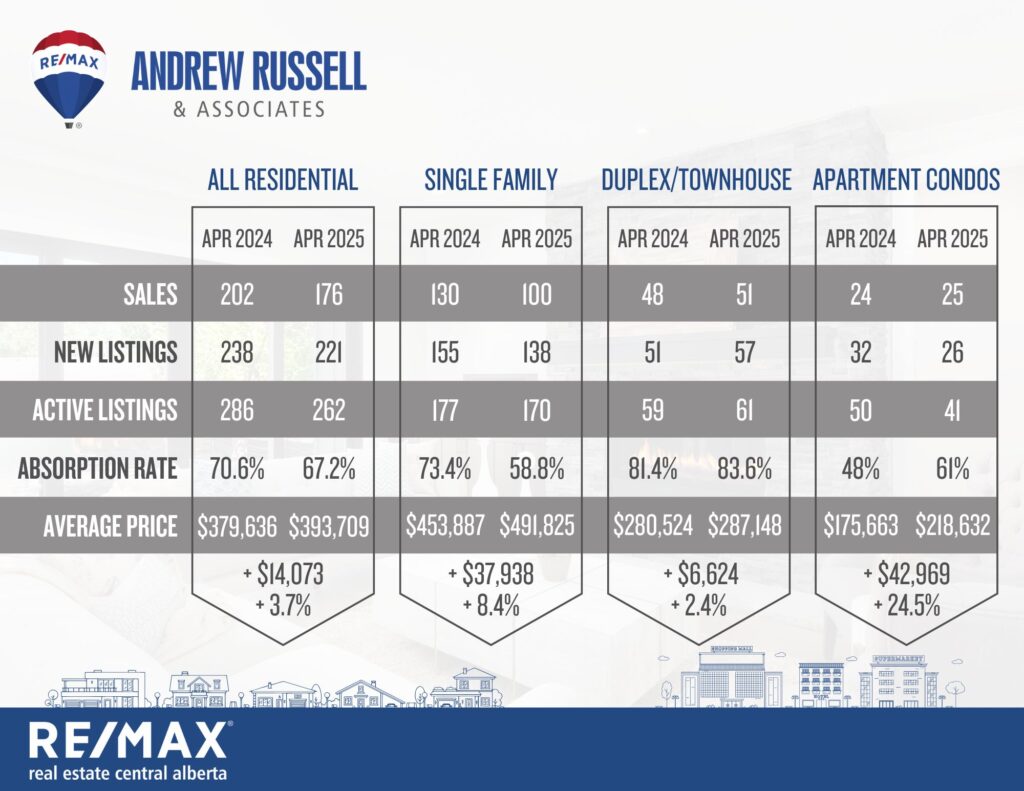
April sales dropped 13% compared to one year ago, and while inventory is still low and demand is good, I do believe we’re starting to see the market shift back to a more balanced state. We noticed a slow down on showings and activity shortly after the federal election was called, and now just over a week after the new government was announced, I believe we’re going to see things start trending to a more balanced market over the next number of months. Some of the higher priced markets are already there, with some even teetering into buyer’s market territory.
As enjoyable as it is to see the value of your home increase, hot seller’s markets and rising prices are not sustainable long term, as eventually price increases will outpace incomes. Alberta still has one of the most affordable markets in the country, and I believe we still have a number of years of great market conditions ahead of us, but it’s easy for a mild slow down to feel like a drop off even though that’s not actually the case. The analogy I like to use is that if you’re driving 140km/h down highway 2, and then quickly reduce speed to 110km/h, even though you’re still moving at a high pace, it feels like you’re crawling. If you’re selling a home in a hot market and the market shifts even slightly, this can be exactly how this feels.
Here are your quick stats for April:
Overall Market Trends
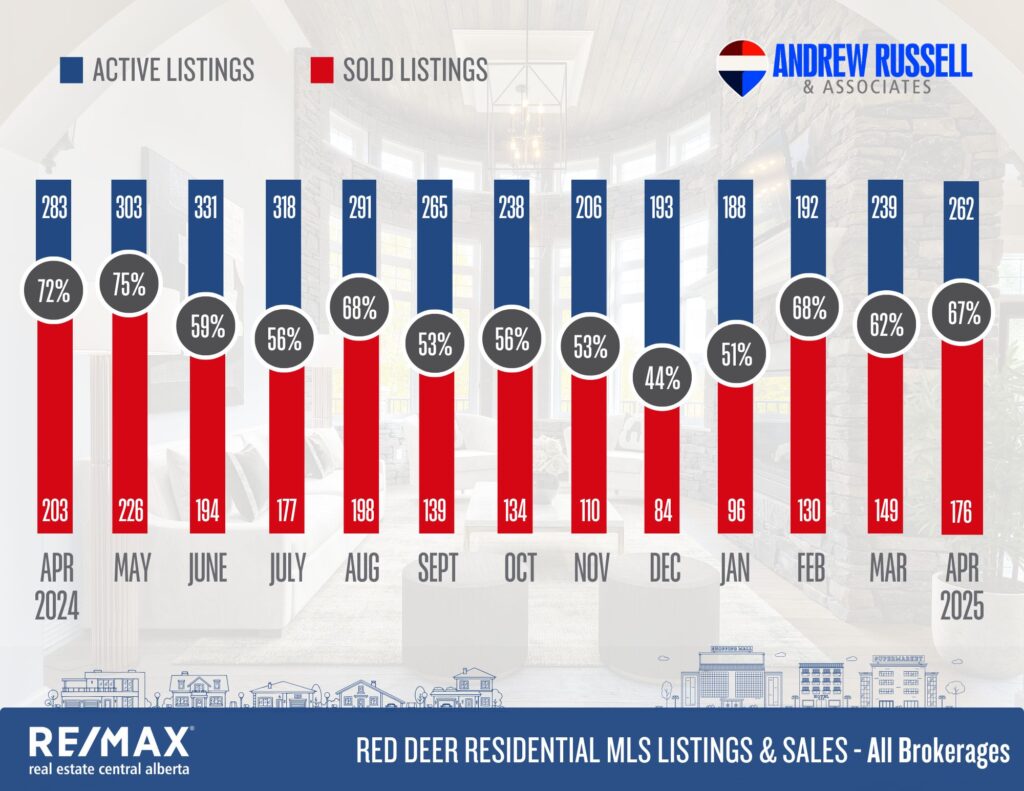
✅ Sales Activity: Total residential sales dipped to 176 in April 2025, down from 202 in April 2024.
✅ New Listings: Slightly decreased to 221 listings from 238 last year, indicating reduced seller activity.
✅ Active Listings: Dropped modestly to 262 from 286, suggesting a continuation of tighter inventory.
✅ Absorption Rate: Slight decrease to 67.2%, down from 70.6%, reflecting a small shift toward a more balanced market.
✅ Average Home Price: Rose by 3.7%, with the average reaching $393,709, up from $379,636.
Single Family Homes
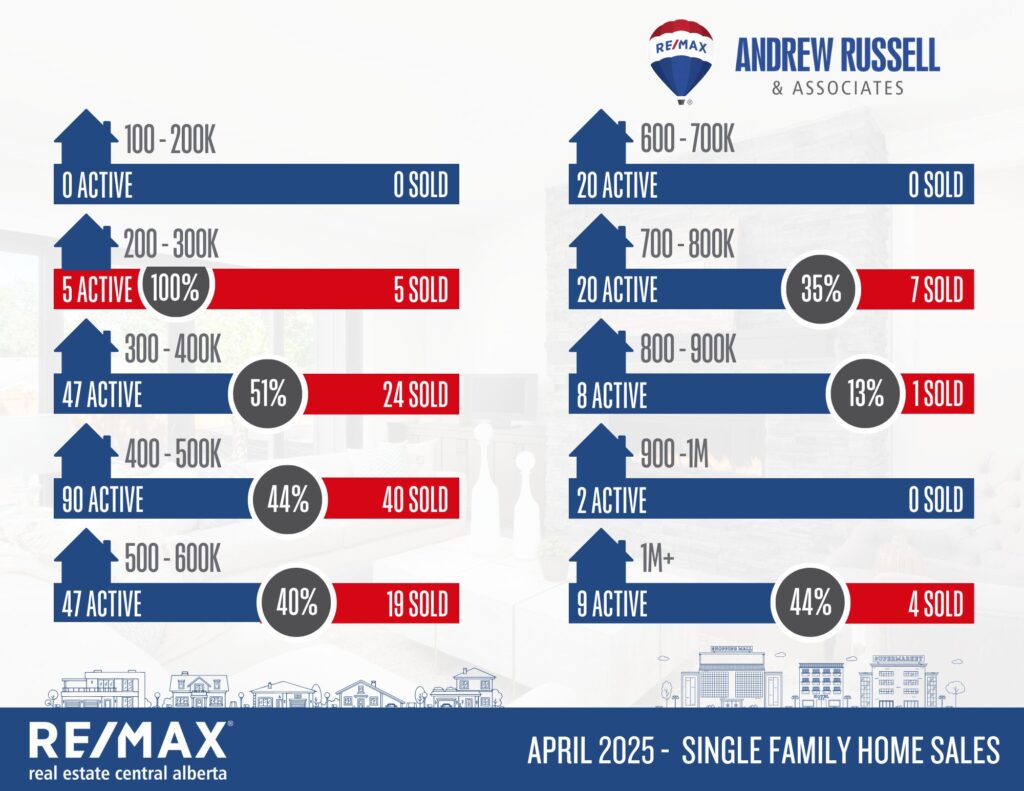
???? Sales Performance: Declined from 130 in April 2024 to 100 in April 2025, this is a 23% decline compared to 1 year ago.
???? New Listings: Dropped from 155 to 138, which may have helped cushion price drops.
???? Absorption Rate: Fell to 58.8%, down from 73.4%, reflecting softer buyer activity.
???? Price Growth: Prices still grew by 8.4%, increasing from $453,887 to $491,825, signaling strong value appreciation despite fewer sales.
Acreage Market
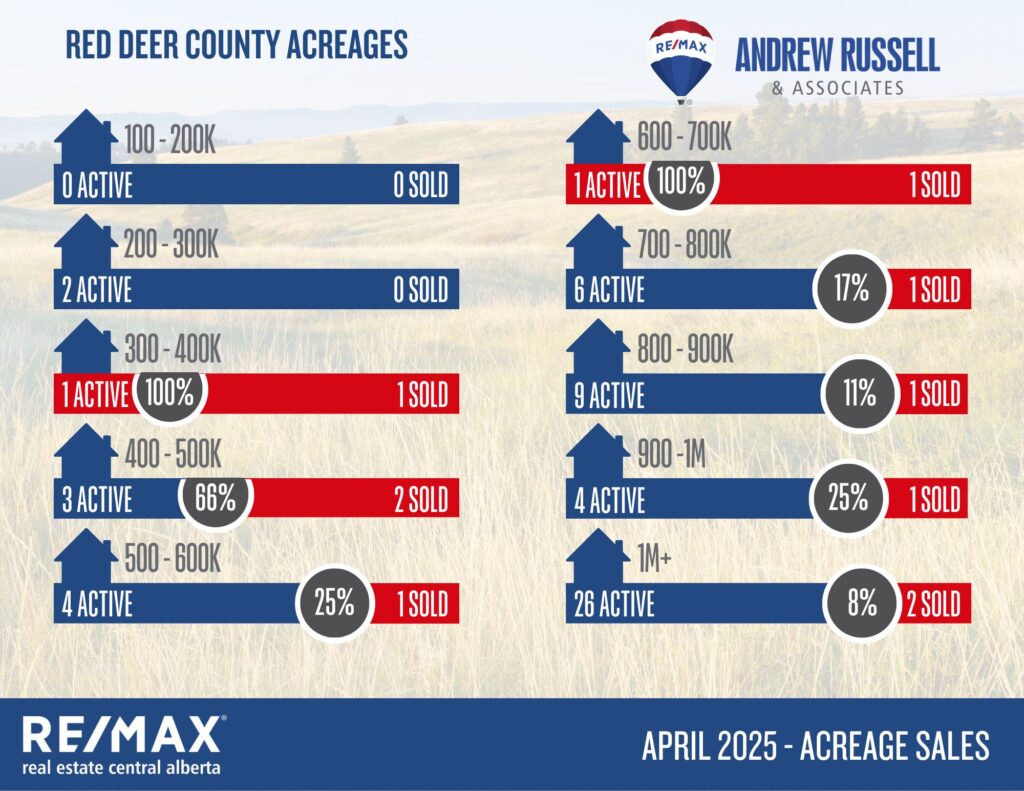
???? Entry-Level Demand: Acreages in the $300K–$500K and $600K–$700K ranges saw strong activity, with near or full absorption in each.
???? Luxury Acreage Slowdown: Properties priced above $700K struggled, with absorption rates from 8% to 25%, showing buyer hesitation at higher price points.
???? Ample High-End Inventory: The $1M+ range had 26 active listings and just 2 sales, suggesting an ongoing buyer’s market for upscale acreages.
Market Supply & Demand Trends
???? Listing Inventory Trend: Active listings decreased year-over-year from 286 to 262, continuing the tightening trend.
???? Buyer Activity Softening: Sales dropped across all residential categories, though absorption remains healthy.
⬆️ Pricing Resilience: Average prices across all property types still saw year-over-year increases despite lower sales volume.
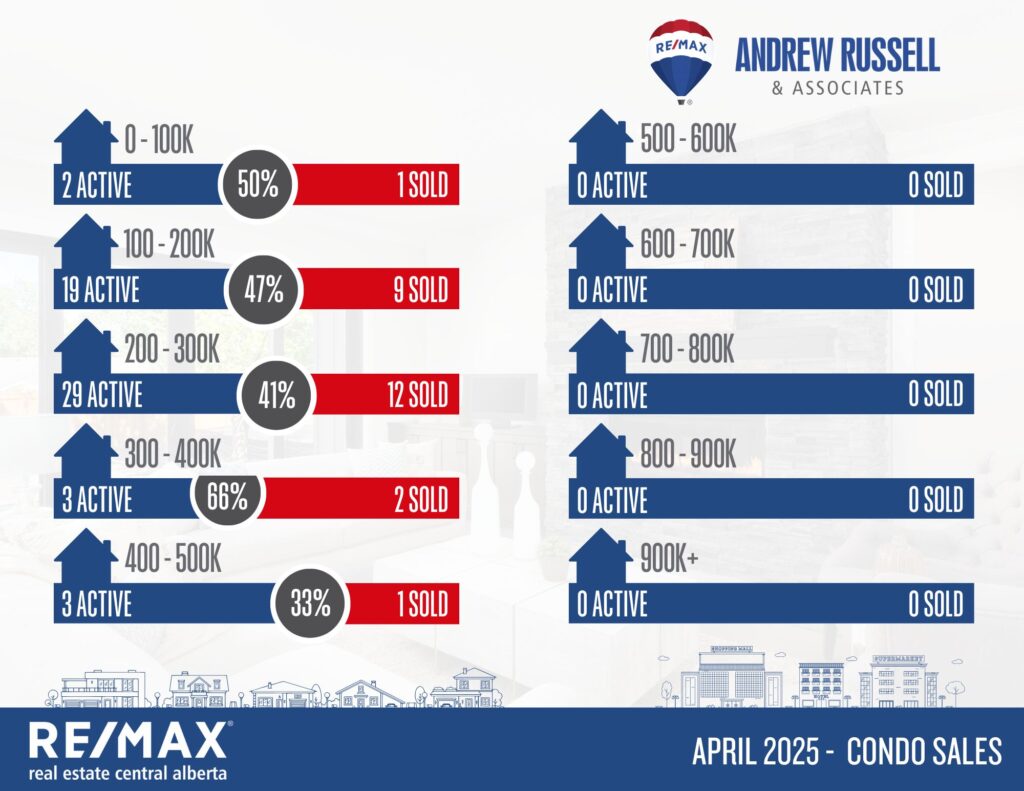
⬆️ Condo Surge: Apartment condos saw the strongest growth in average price at +24.5%, from $175,663 to $218,632.
⬆️ Duplex/Townhouse Market: Strong absorption rate at 83.6%, with slight price appreciation (+2.4%).
What This Means for Buyers and Sellers
Buyers:
✅ Higher Price Tags: Especially in the condo and single-family sectors.
✅ Inventory Still Tight: Acting quickly remains crucial for desirable homes.
✅ Opportunities in High-End Homes: Slower sales in $600K+ price ranges create room for negotiation.
Sellers:
✅ Solid Pricing Power: Year-over-year price increases are still being realized.
✅ Best Price Ranges to Sell: $200K-$500K single-family homes perform best.
✅ Stale Luxury Listings: High-end home and acreage sellers may need to adjust pricing or presentation.
✅ Spring Strategy: Early listing in spring remains key before summer inventory rises.
Surrounding Community Snapshot:
Blackfalds:
Current Active Listings – 49
Sales in April – 26
Likelihood to Sell – 53% (Seller’s Market)
Sylvan Lake:
Current Active Listings – 81
Sales in April – 41
Likelihood to Sell – 51% (Seller’s Market)
Penhold:
Current Active Listings – 12
Sales in April – 6
Likelihood to Sell – 50% (Seller’s Market)
